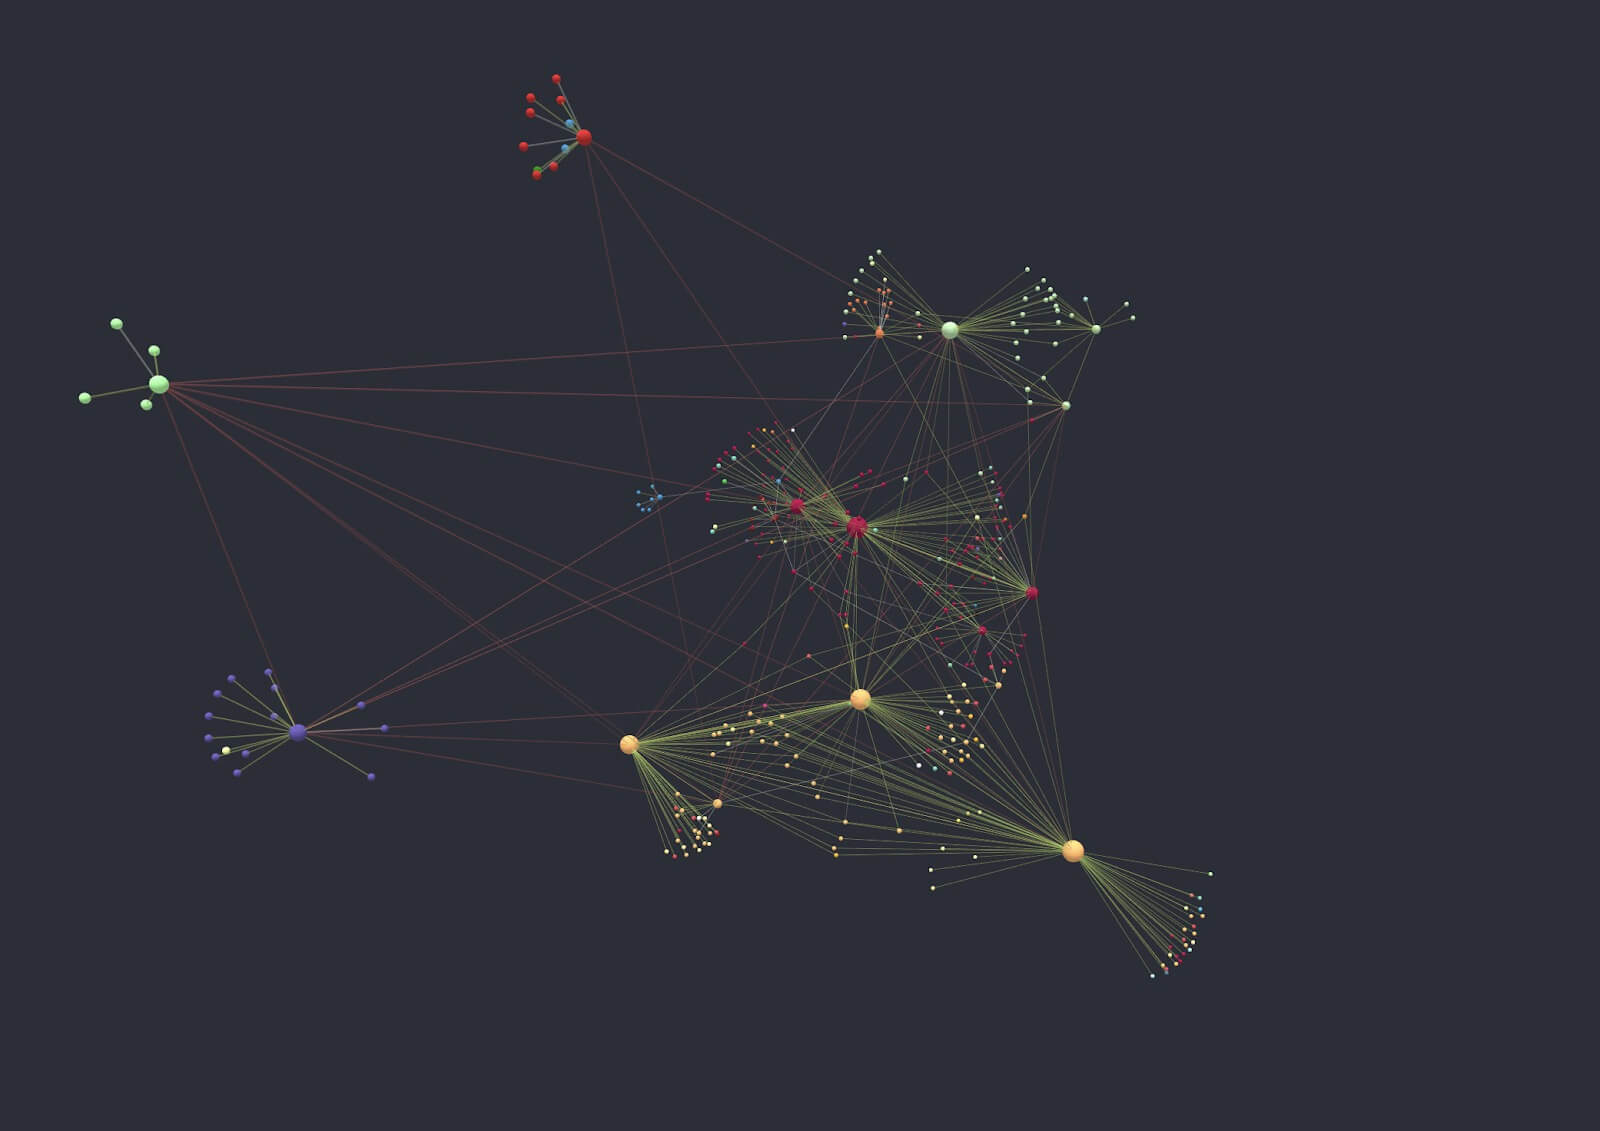
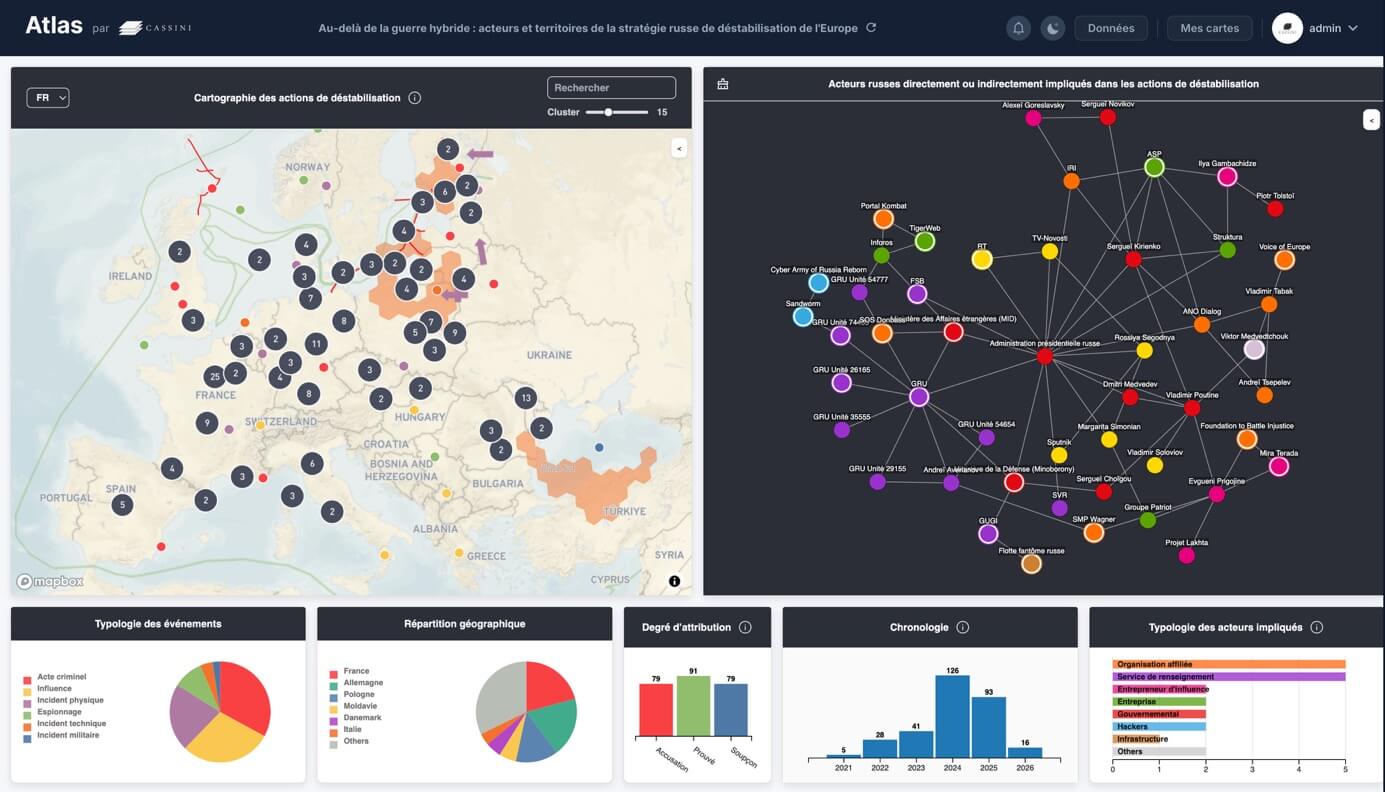
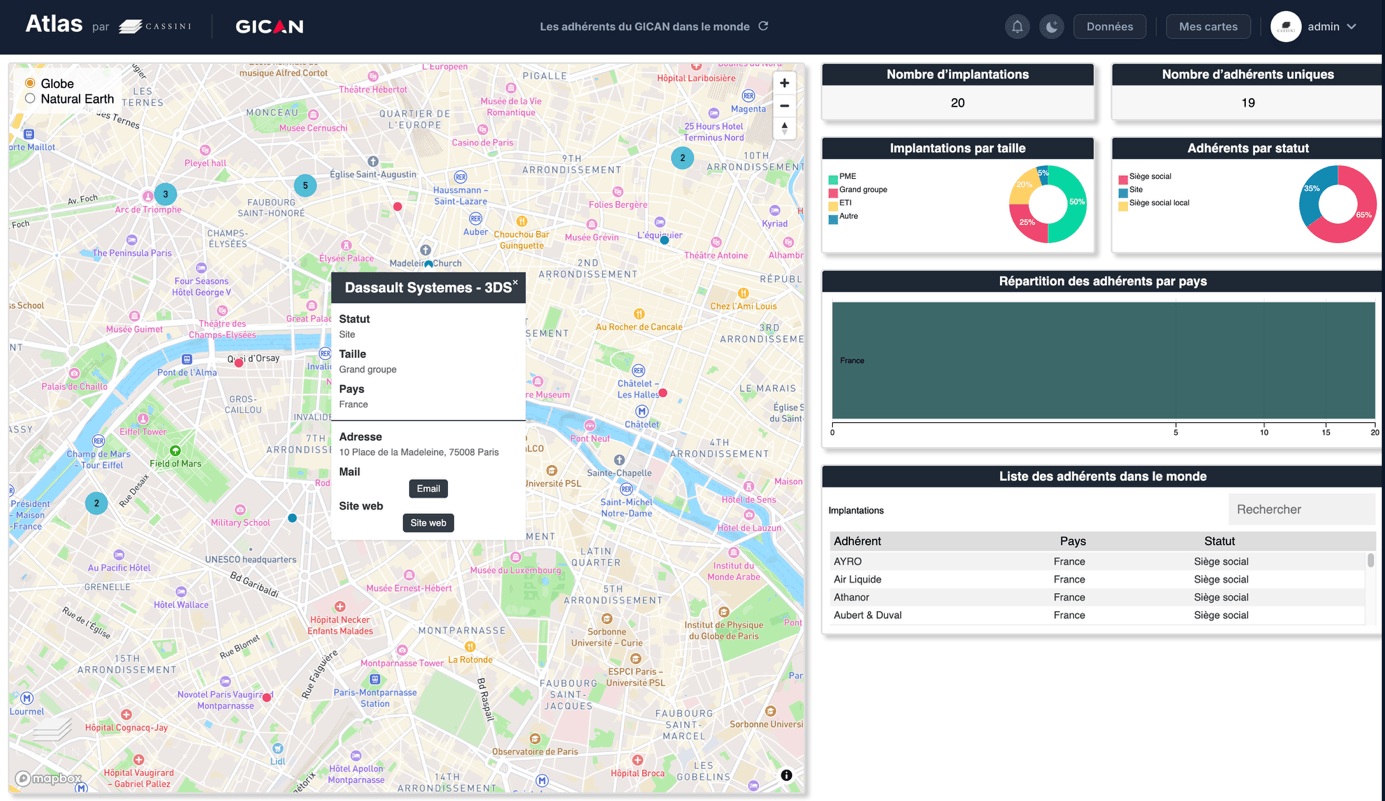
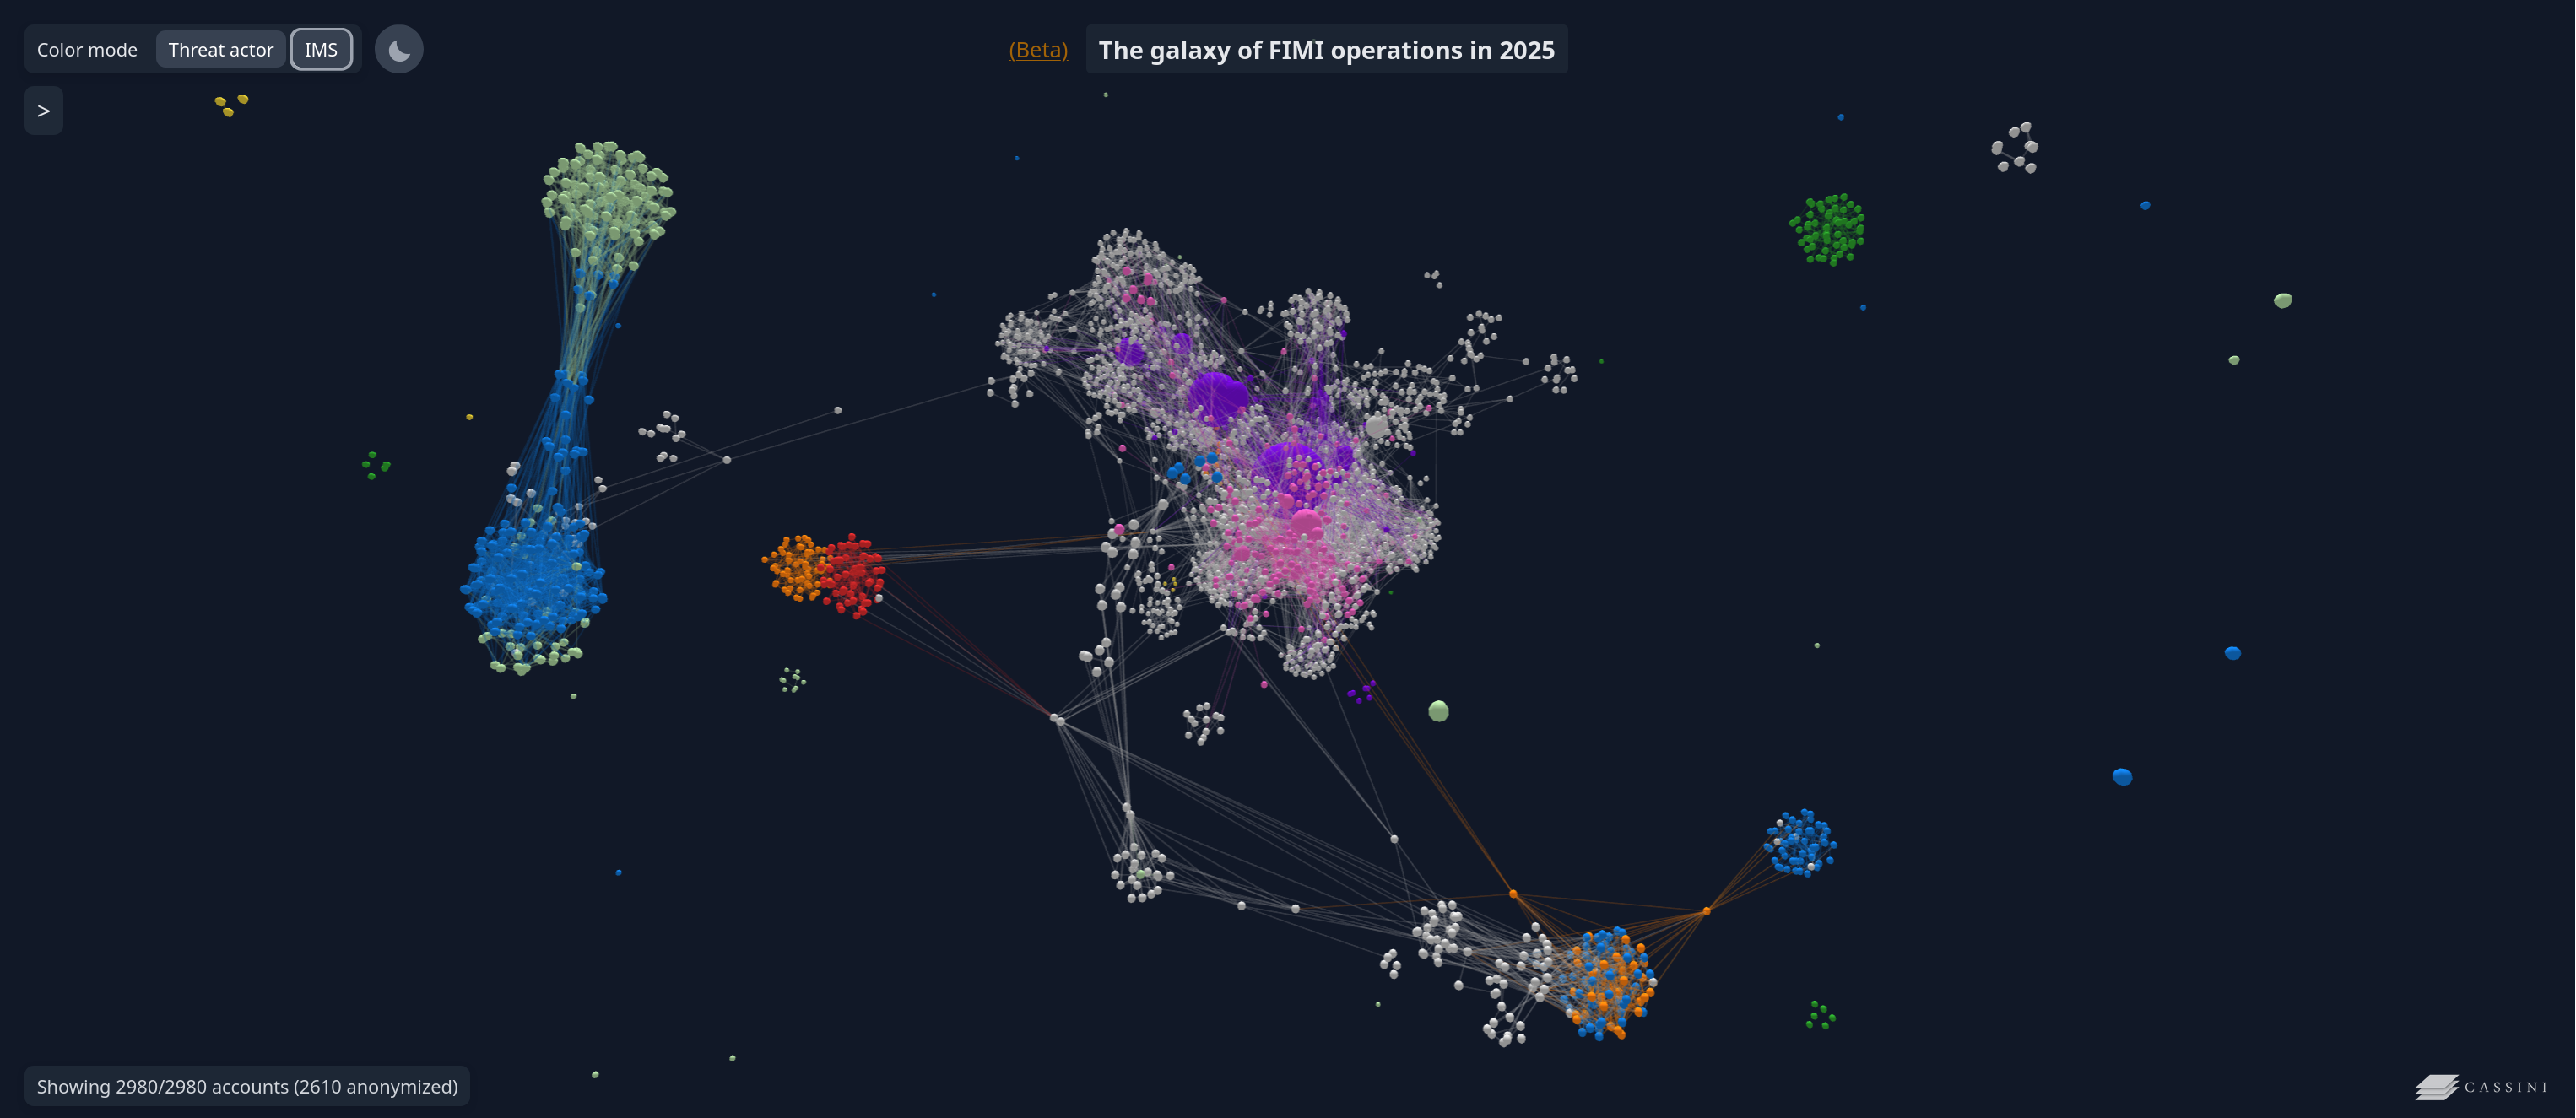
Geopolitical mapping
Representing a territory to understand and communicate
Mapping is central to CASSINI's approach, as it embodies the firm's geopolitical method: by identifying multiple thematic layers and integrating them within a single framework, our maps provide a structured interpretation of the issues at stake and transform data into strategic information.
A well-designed geopolitical map does more than illustrate; it structures analysis, reveals underlying dynamics, and prioritises complex information. Our maps and infographics are developed as genuine territorial intelligence tools, equally valuable for decision-making, explanation, persuasion, and communication.
Our work combines scientific rigour, data expertise, and high graphic standards. Depending on your requirements, it can complement a broader study or serve as an independent deliverable.
Your needs
- Visualise complex issues to support understanding and the internal circulation of strategic information
- Map risks, areas of tension, vulnerabilities, stakeholders, flows, and infrastructure
- Position a project within its territorial environment, considering constraints, opportunities, access, resources, and dependencies
- Produce clear materials for an executive committee, steering body, client presentation, institutional communication, or public presentation

Our analyses are based on several complementary pillars, combined according to your requirements.
Our mapping work is based on a rigorous methodology derived from geography and geopolitical analysis, structured to organise spatial information in order to reveal power relations and territorial dynamics.
We divide a territory into thematic sets – political, socio-economic, security, infrastructure, environmental, and others – and then overlay these layers to highlight key features and structuring relationships.
Our maps use extensive geospatial databases, as well as qualitative analytical inputs – local knowledge, historical context, and social and political factors – to avoid producing simple visualisation maps lacking analytical framing.
Depending on the objective, we prioritise either analytical depth – through fine-grained, multi-level interpretation – or pedagogical clarity, with direct messaging and maximum readability.
In addition to geographic maps, we produce diagrams, organisational charts, and relational graphs to represent power networks, value chains, and sectoral ecosystems when the territorial dimension is not essential.
We create this work using Geographic Information Systems and graphic design tools to ensure precision, visual consistency, and high publication standards.

Different cartographic formats
We produce cartographic deliverables tailored to your strategic needs. Depending on the objective, our work may take several forms:


