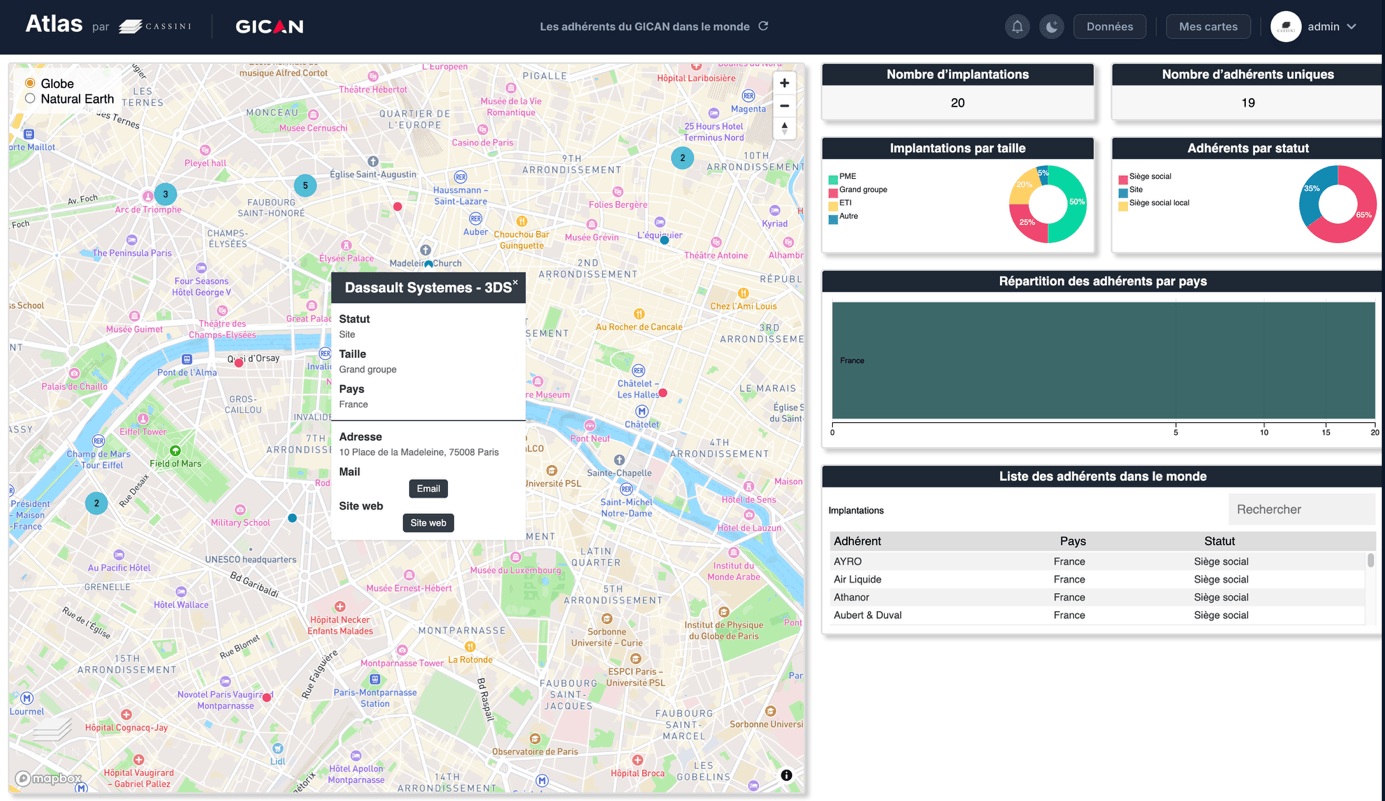
Interactive Atlas
Explore, cross-reference and share your data with an operational tool
CASSINI's Interactive Atlas is a mapping and interactive dashboard solution that enables your teams to explore a territory, stakeholder network or dataset dynamically.
Unlike a static published map (see Service 3), the Atlas provides access to an environment where information can be filtered, compared, prioritised and updated, allowing you to monitor a situation and quickly draw insights to support action.
The Atlas can be custom-built from your data – whether internal or open-source – and structured around your specific use cases: steering, monitoring, analysis, reporting and internal dissemination.
You are looking to:

Geospatial intelligence designed for the field
Our Atlas expertise is based on a structured design methodology, focused on decision-making and tailored to your operational environments.
We begin with your decisions and operational questions to shape the tool: selecting indicators, views, filters, and levels of analysis.
The Atlas cross-references and prioritises data to highlight key elements and facilitate interpretation.
The tool is built around your data and constraints – access, security, governance – and your user profiles, whether leadership, analysts, field teams or communications teams.
The Atlas is designed to provide a seamless user experience via the internet, while maintaining access management mechanisms and a back office suited to administration.
The Atlas can incorporate analytical layers – risk mapping, stakeholder typologies, timelines and indicators – derived from our research, monitoring and mapping work.

Interactive dashboards and monitoring workflows
Custom-built to your needs, the Atlas brings together a coherent set of analytical and operational features:
A web application with interactive maps and dashboards
Filters and thematic views by area, timeframe, stakeholder type, risk level, and key indicators
Dedicated mapping layers covering risks, infrastructure, flows, stakeholder networks, and value chains
Monitoring features for tracking changes, comparing situations, exporting data, and supporting reporting
User documentation and, where needed, training to ensure teams can use the tool independently
